Before we start, where are you on your own sustainability journey?
1. Is your business going to undertake sustainability actions this year? |
No, not yet → |
OK. Perhaps you might like to see our latest sustainability updates and information. |
| Yes, that sounds like us ↓ | ||
2. Do you have emission reduction ambitions and are they communicated to staff, customers, investors and/or suppliers? |
No, not yet → |
It looks like you may be assessing your overall sustainability ambitions and targets - here is some guidance you may find helpful. |
| Yes, that sounds like us ↓ | ||
3. OK, are those ambitions expressed as clear targets, and do you have what you need to achieve them? |
No, not yet → |
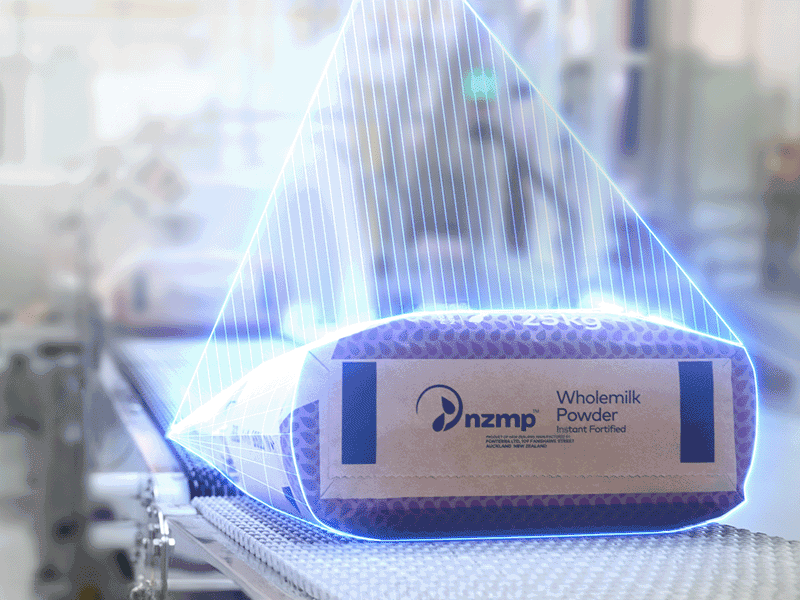
That's great, because we can provide emissions footprint information for our New Zealand sourced NZMP products - register to receive carbon footprint certificates for NZMP ingredients. |
| Yes, that sounds like us ↓ | ||
| Seems you are well on the way. You might like to look at our Climate Roadmap: Our strategy to netzero 2050 | ||
If you prefer to browse, here are some direct links to the content.


Disclaimer: This content is general information and intended for use as a guide only and is not in the nature of advice which may be relied upon. While all reasonable care has been taken in its preparation, no warranties or representations are provided with respect to the accuracy or completeness of any information contained in this content. Fonterra and its respective subsidiaries, affiliates and associated companies (and its respective officers, employees or agents) shall not be liable for any loss arising from any actions or decisions taken in reliance on the information contained in this content.

